Free download
Weekly growth tracker for a new TikTok Shop tool site
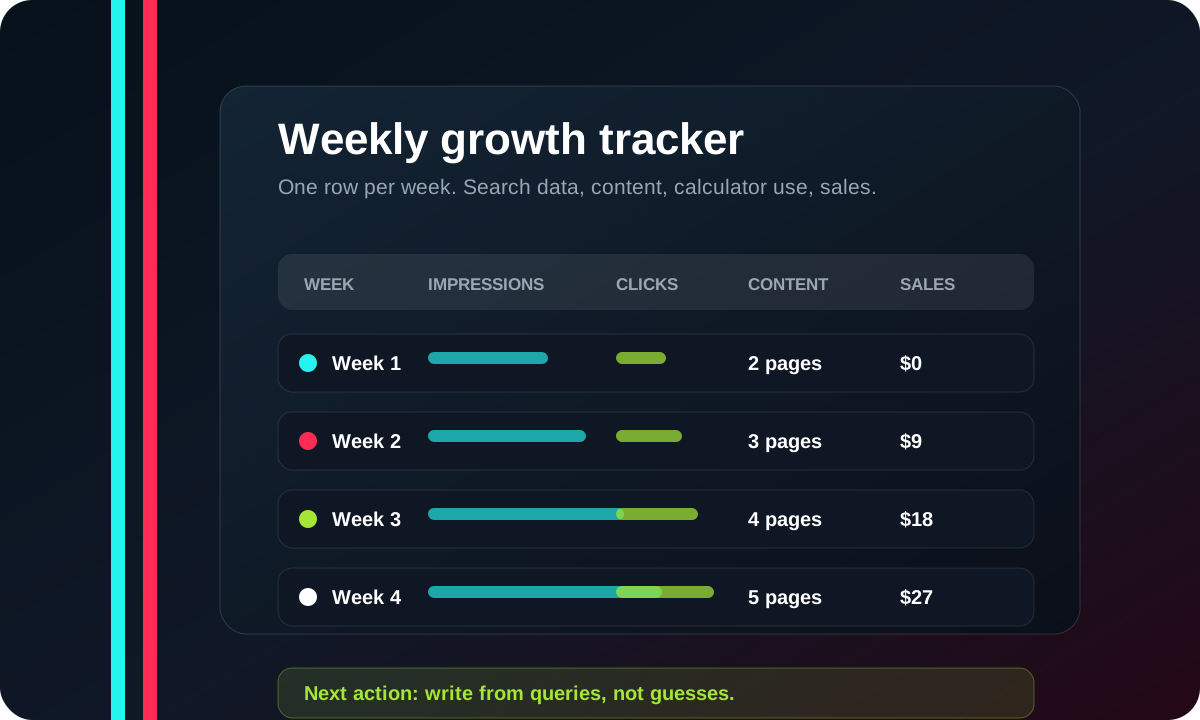
Use this CSV once a week to record the numbers that matter: Search Console impressions, clicks, content published, calculator visits, and $9 sheet sales.
Download the tracker
This is a plain CSV file. Open it in Google Sheets, Excel, or Numbers. Keep one row per week. Do not edit it every hour.
What to record
| Column | Why it matters | Beginner rule |
|---|---|---|
| GSC impressions | Shows whether Google is testing your pages. | Look weekly, not daily. |
| GSC clicks | Shows whether searchers are choosing your result. | Do not judge CTR before there is enough data. |
| Top query | Shows what people actually searched. | Turn repeated product queries into example pages. |
| Calculator visits | Shows whether free-tool traffic is growing. | This is the main early signal. |
| $9 sheet sales | Shows whether the free path can convert. | Track sales, but do not panic in month one. |
How to use it
- Pick one review day each week.
- Record Search Console totals for the last 7 days.
- Write down the top query and top page.
- Record how many new examples and guides went live.
- Choose one next action: write more, fix a title, improve a page, or prepare a small ad test.
Keep the $9 sheet separate
This tracker is for site growth. The $9 Seller Starter Sheet is for product testing. Keep them separate so you do not mix traffic data with product margin decisions.
Source notes
References to check
The visual above is original to ShopROAS. These references explain the metrics and reports used in the tracker.
Use this for clicks, impressions, CTR, average position, pages, and queries.
Source 2 Google Search Console sitemaps reportUse this to check whether Google can read the sitemap.
Source 3 Google Analytics eventsUse this later if you track calculator use, outbound checkout clicks, or downloads.
Source 4 Google Ads daily budgetsUse this before running a small calculator landing page test.